Mapping of local currents
The very first mechanism for detecting the distance between tip and surface which had been used in microscope design was tunelling current.
If two conductive objects approach each other to very small distance and if these two object are at different potential, then electric current flows through the energetic barrier. The current magnitude rises very quickly as the gap gets smaller which is convenient for loopback design. This is the basic of STM - scanning tunneling microscope.
M - scanning tunneling microscope).
In the field of experiments in very high vacuum STM and related measurement I-U curves (STS - scanning
tunneling spectroscopy) still belong to the most attractive methods (see example MFF UK pages). However, the use of STM in metrology is limited - it is dedicated for concuctive samples analysis and tips are not as geometrically well defined as in AFM.
|
If we use the current between the probe and the surface only as a signal with additional information we get C-AFM (conductive atomic force microscopy). This method allows to detect local conductivity of material simultaneously with topography measurement.
From the instrumentation point of view the conditions which must be met are that the tip must be conductive and current-voltage converter suitable for very small currents must be used. In commercial microscopes the module for electrical measurement is often hardware combined together with other options of mapping of electrostatic forces and contact potential.
| 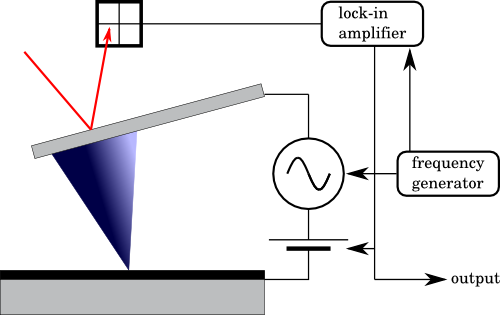 |
| Scheme of AFM in measuring currents and mapping of electric fields |
Quantitative measurement
The optimum results of measurement in conductive AFM would be the spatial distribution of electric conductance in sample volume or at least in thin surface layer. From the metrology point of view it is necessary to consider following issues:
- calibration of current-voltage converted in whole its range
- estimate of uncertainity given by contact resistance between tip and the surface
- analysis of topology effect on measured data
- relation between current though the probe and the sample and conductivity in sample volume.
Many of the questions in measurement and interpretation of data from local conductivity lead to numerical simulation. The properties to study are field distribution or carrier transport or both. Therefore, many experiments in this area are at present mostly of qualitative character.
|

